Truck/Lane Min/Max Forces Report
The Truck/Lane Min/Max Forces report for LFD and LRFD designs is identical except for the presentation of Impact and Live Load Distribution Factors.
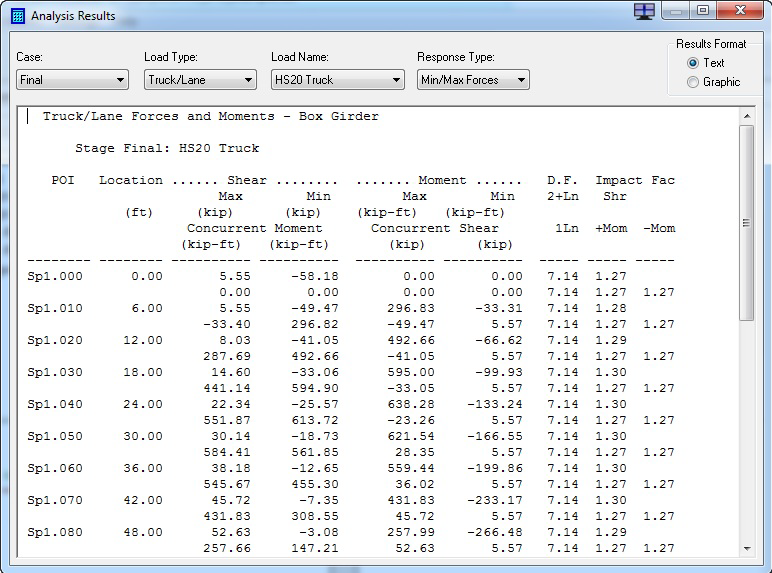

The first two Max and Min columns show the maximum positive shear and maximum negative shear. Below these results is the corresponding moment associated with the location of the truck (or portion of the influence line for lane loading) that produced the maximized shear values.
The second two Max and Min columns show the maximum positive moment and maximum negative moment. Below these results is the corresponding shear associated with the location of the truck (or portion of the influence line for lane loading) that produced the maximized moment values.
The last three columns for both LFD and LRFD reports show impact and live load distribution factors. For the LFD report, the column labeled D.F./2+Ln/1Ln shows the multi-lane (2+Ln) and single lane (1 Ln) distribution factors. The columns under Impact Factor show the shear and the positive and negative moment distribution factors. For LRFD, the column labeled D.F./Shr/Mom shows the multi-lane shear and moment distribution factors. The column labeled Imp/Shr/Mom shows the shear and moment impact factors, and the column labeled DF1Ln/Shr/Mom shows the single lane shear and moment distribution factor.
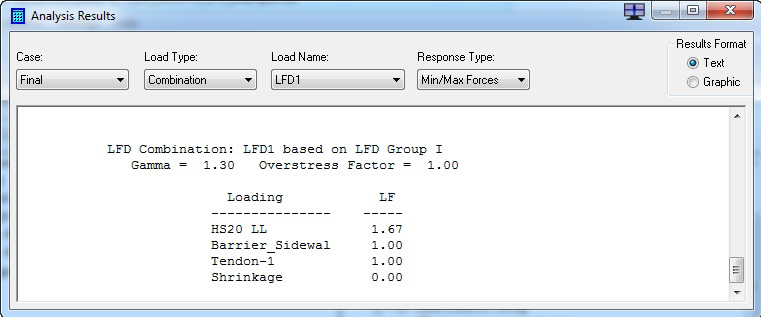
The Min/Max Forces report for Live Loads, Pedestrian Loads and Load Combinations has an identical format to the Truck/Lane report except impact and distribution factors are not presented. In addition, the report for combinations shows information at the bottom of the report to indicate what loadings and factors were used to build the combination.

.